Plot IGM analysis with PyMol
Plot IGM analysis from Multiwfn using PyMol. IGM is an useful analysis of spatial distribution of steric hindrance. Plotting IGM result is much easier and looks better in PyMol.
Related Multiwfn Documents
http://sobereva.com/407Related PyMol Documents
https://pymolwiki.org/index.php/Ramp_New
Run IGM analysis
- Save optimized geometry as .mol2 file
So that can be opened by both Multiwfn and Gview
- load into Multiwfn & run IGM Now we have
20
10
2               // 2 fragments
[atom index]    // fragment #1 (atom group tool from Gview helps)
[atom index]    // fragment #2
2               // grid quality
3 // save files to current dirdg_inter.cub,dg_intra.cub,dg.cubandsl2r.cub.
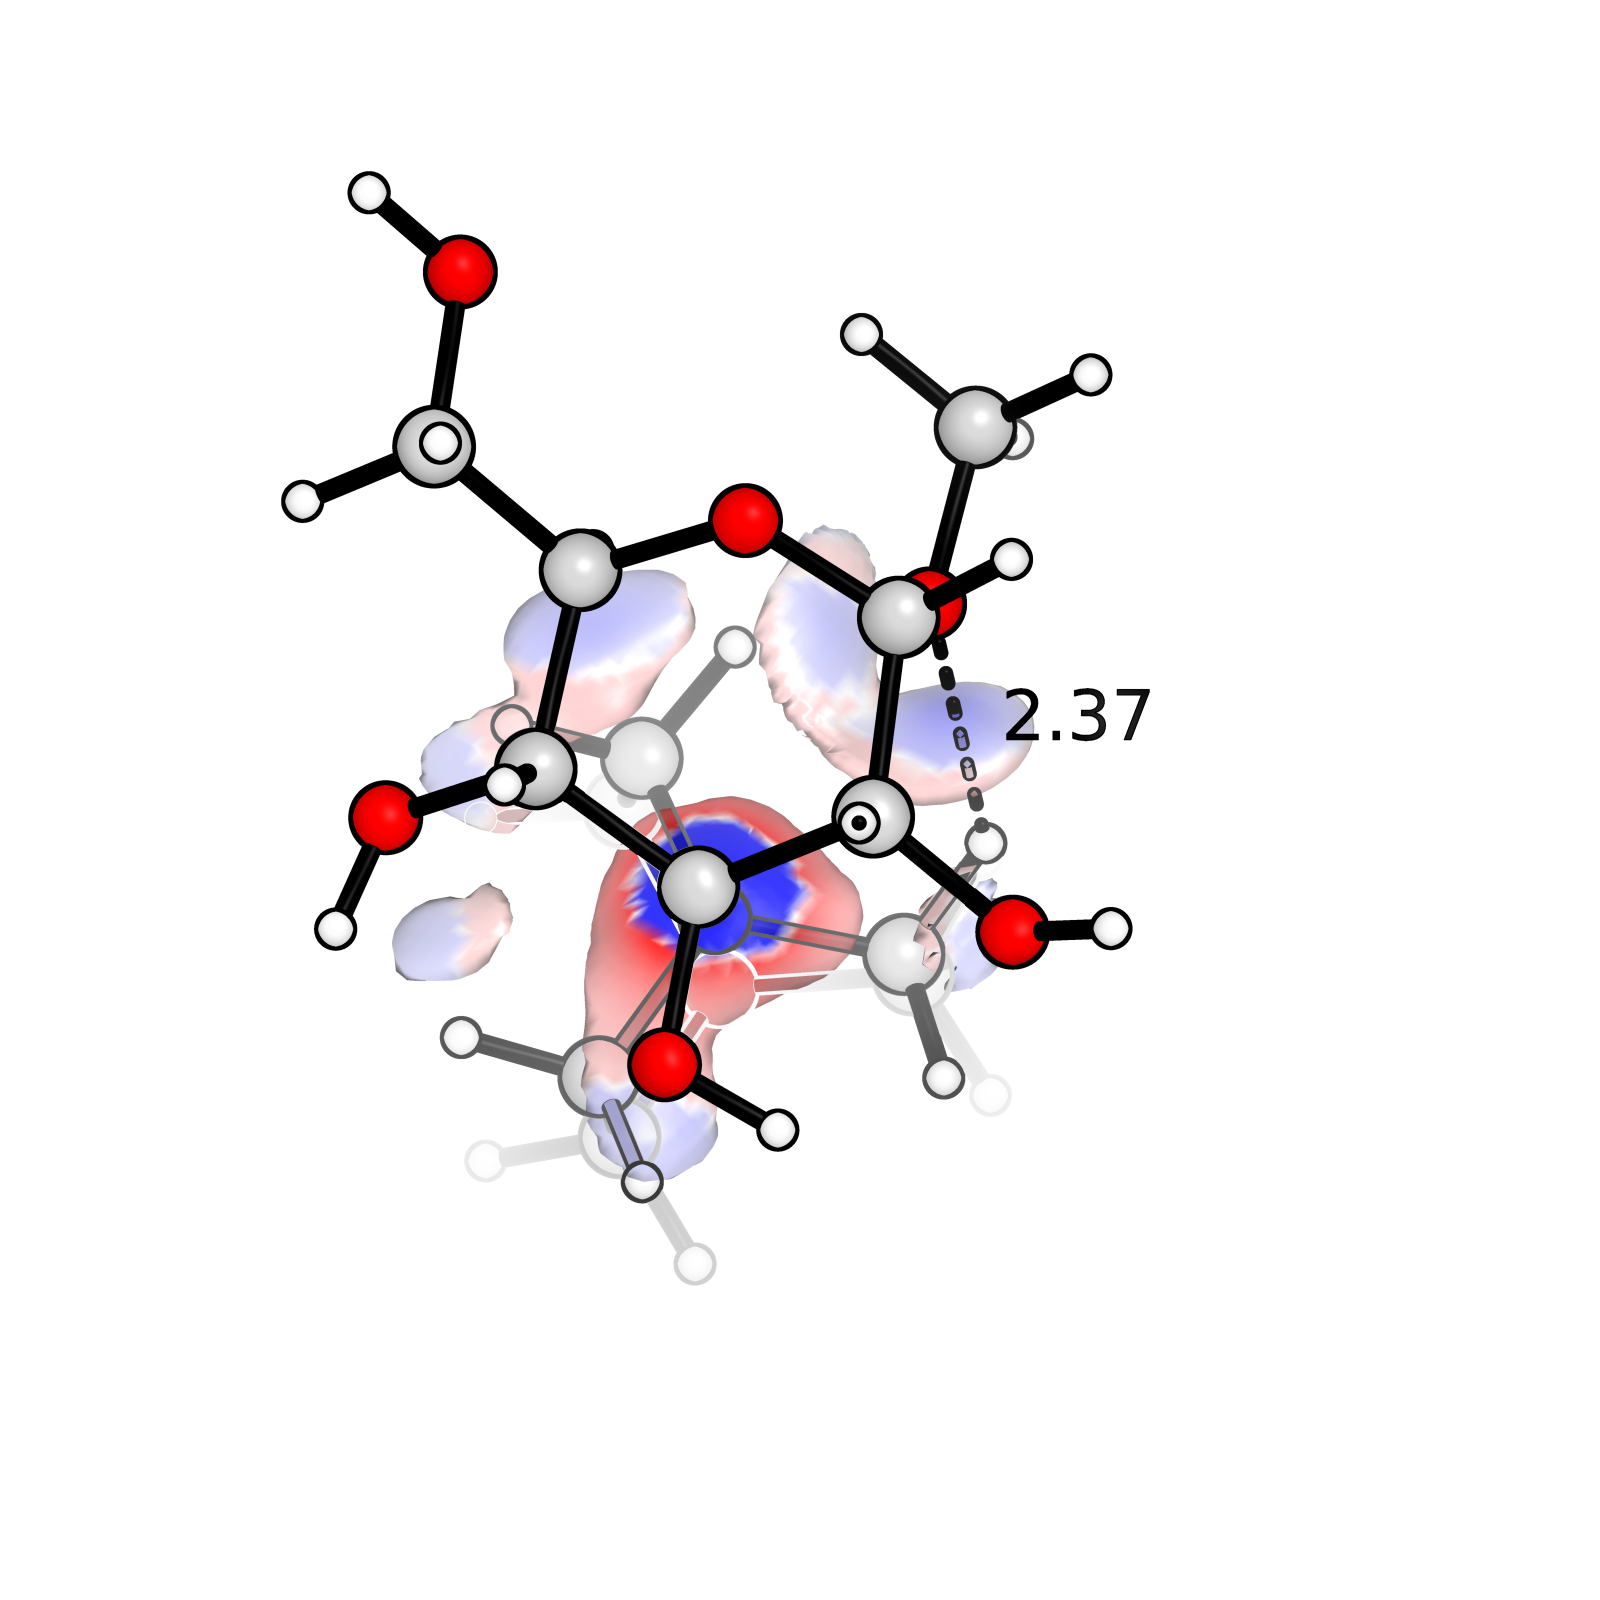
Plot with PyMol
- load the
.mol2,dg_inter.cubandsl2r.cubinto PyMol. - Use “Other Visualization Settings for structures” from https://www.shaoqz.cn/2020/06/29/PyMol-Orbital/
- Build IsosurfaceGrammer:
isosurface IGM1, dg_inter.cub, 0.01
set transparency, 0.2isosurface {new object name}, {.cub name}, {isovalue} - Color the surface with sl2r
ramp_new ramp1, sl2r, [-0.05, 0, 0.05], [blue, white, red]
color ramp1, IGM1